USING THE DATASET
Contents
Loading
init;
d=DatasetLoaderToulouse();
imgData = d.getImageDataAtIndex(3);
imgData = d.getImageDataAtImageName('img_1295');
width = size(imgData.img, 2);
height = size(imgData.img, 1);
Details on the data
size(imgData.img)
K = imgData.K
lines = imgData.lines
linesEq = imgData.linesEq
name = imgData.name
R_imu = imgData.R_imu
vp_association = imgData.vp_association
ans =

        1080        1920           3


K =

   1.0e+03 *

    1.7572         0    0.9748
         0    1.7532    0.5463
         0         0    0.0010


lines =

           1         995         709         366
         265        1078         789         398
         807        1077         943         483
        1854         865        1548         567
         276         542         218           1
         359           1         404         474
        1429           1        1392         510
           9         992        1918        1023
         381         535        1346         540
        1795         816         224         797


linesEq =

         629         708     -705089
         680         524     -745072
         594         136     -625830
         298        -306     -287802
         541         -58     -117880
        -473          45      169762
        -509         -37      727398
         -31        1909    -1893449
          -5         965     -514370
          19       -1571     1247831


name =

img_1295


R_imu =

   -0.3452   -0.9380   -0.0316
   -0.2458    0.1229   -0.9615
    0.9058   -0.3241   -0.2730


vp_association =

  Columns 1 through 3

                    1                    1                    1

  Columns 4 through 6

                    1                    2                    2

  Columns 7 through 9

                    2                    3                    3

  Column 10

                    3
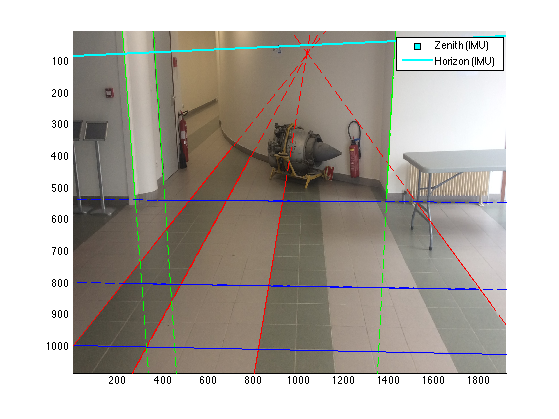
Display
axis([1 width 1 height]);
color = ['r', 'g', 'b'];
hold on;
imagesc(imgData.img);
for i=1:size(imgData.lines,1)
plot(imgData.lines(i,[1,3]), imgData.lines(i,[2,4]), color(imgData.vp_association(i)));
hline(cross([imgData.lines(i,1:2) 1]', [imgData.lines(i,3:4) 1]'), 'LineStyle', '--', 'Color', color(imgData.vp_association(i)));
end
zenith = imgData.K * imgData.R_imu * [0 ; 0 ; -1];
zenith = zenith / zenith(3);
horizon = imgData.Kinv' * imgData.R_imu * [0 ; 0 ; -1];
pzenith = plot( zenith(1), zenith(2), 's', 'LineWidth',1, 'MarkerEdgeColor','k', 'MarkerFaceColor', 'c', 'MarkerSize',6);
phorizon = hline(horizon, 'color', 'c', 'LineWidth',2);
legend(gca, [pzenith, phorizon], 'Zenith (IMU)', 'Horizon (IMU)');
axis ij;
hold off;